|
|
此文翻译自 Visual Studio Code 官方文档,地址在 Debugging and Testing Java in Visual Studio Code。欢迎转载,转载请保留出处。
另外,文中部分演示动图有问题,可以移步至官方文档中观看。
Visual Studio Code 通过安装 Debugger for Java 扩展插件后是一个非常优秀的 Java 应用程序开发工具。这是一个基于 Java Debug Server 的轻量级调试器,继承自 Language Support for Java by Red Hat 插件。
下面是这个调试器支持的调试功能:
- Launch/Attach
- Breakpoints
- Exceptions
- Pause & Continue
- Step In/Out/Over
- Variables
- Call Stacks
- Threads
- Debug Console
此调试器是一个开源的项目,欢迎任何人通过 GitHub 给他提交代码:
- Debugger for Java Extension
- Java Debugger Server for Visual Studio Code
如果你想调试 JUint test,你可以安装 Java Test Runner 插件,这是另外个轻量级的扩展,你可以通过它来管理你的项目中的测试用例。
安装
在使用调试器之前,你需要安装 Language Support for Java(TM) by Red Hat 插件。不过,有更容易的方式,就是安装 Java Extension Pack ,它帮你集成好了 Language Support for Java(TM) by Red Hat, the Debugger for Java 以及其他很多流行常用的 Java extensions。
你可以通过在扩展视图( 快捷键 Ctrl + Shift +x)的搜索框中输入 vscode-java-pack 来安装这些插件。或者是在第一次编辑 Java 文件的时候,通过编辑器的提示来进行安装。
使用
调试器非常易于使用:
- Launch VS Code. (启动 VS Code)
- Open a Java project (Maven/Gradle/Eclipse). (打开一个 Java 工程)
- Open a Java file to activate the extensions. (打开一个 Java 文件激活调试插件)
- (Optional) Add debug configurations and edit the launch.json configuration file. (可选操作:可以通过编辑 launch.json 文件来增加调试参数)
- Press kb(workbench.action.debug.start).
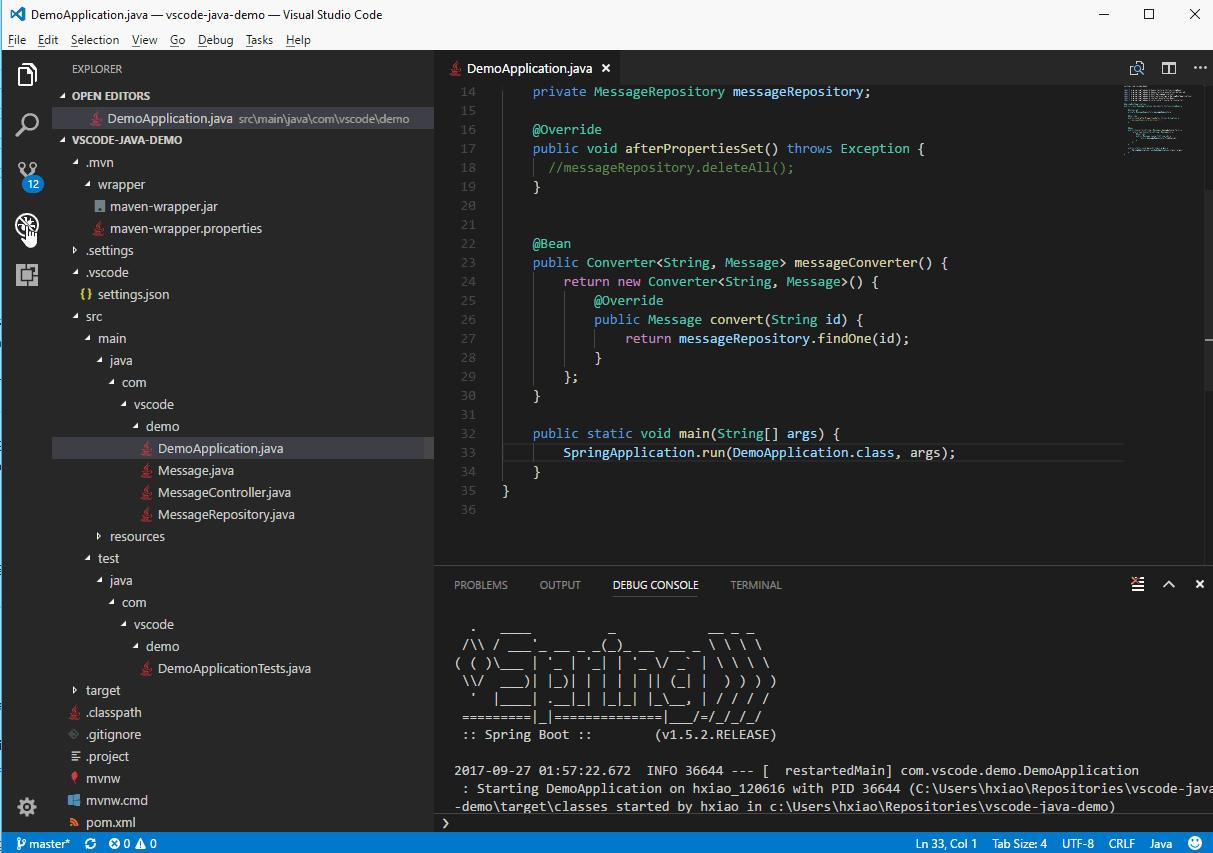
如果你的工程中没有 launch.json 文件,调试器会自动找到 main class,然后来启动你的程序。
你可以自己编辑 launch.json 来设置一些调试参数。
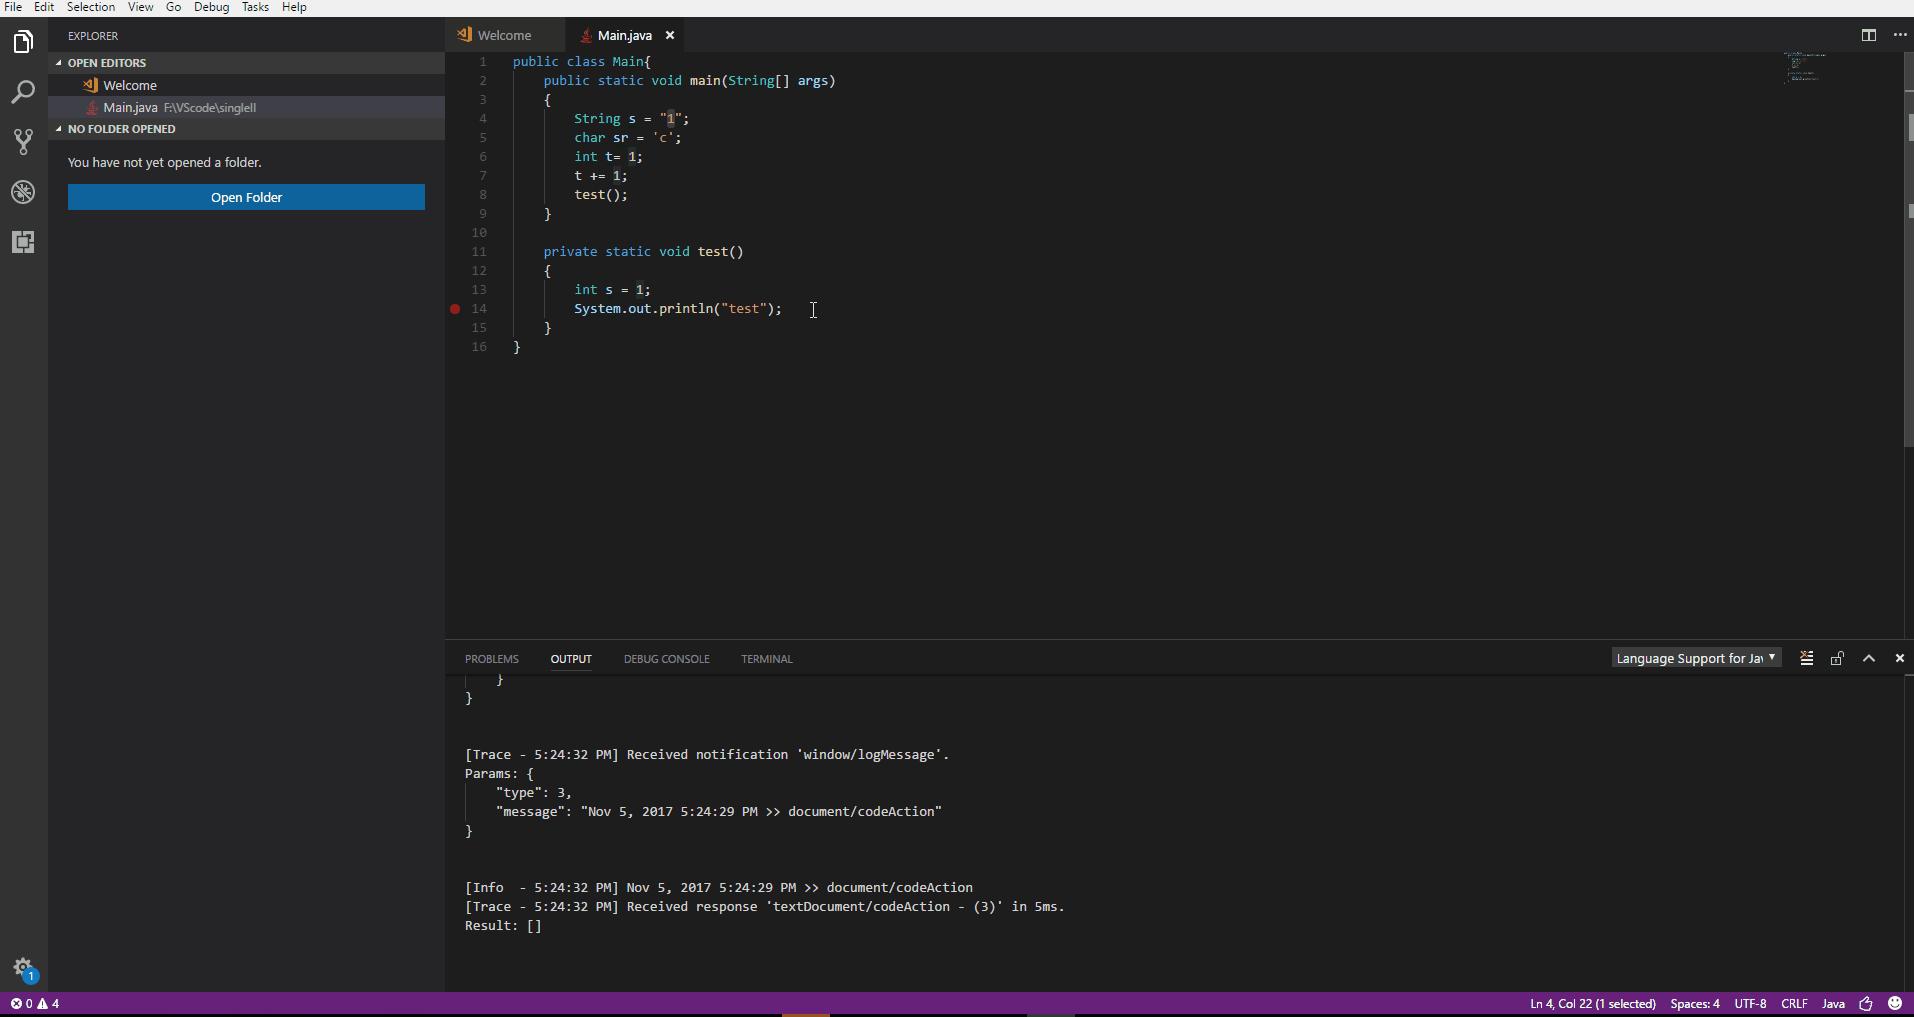
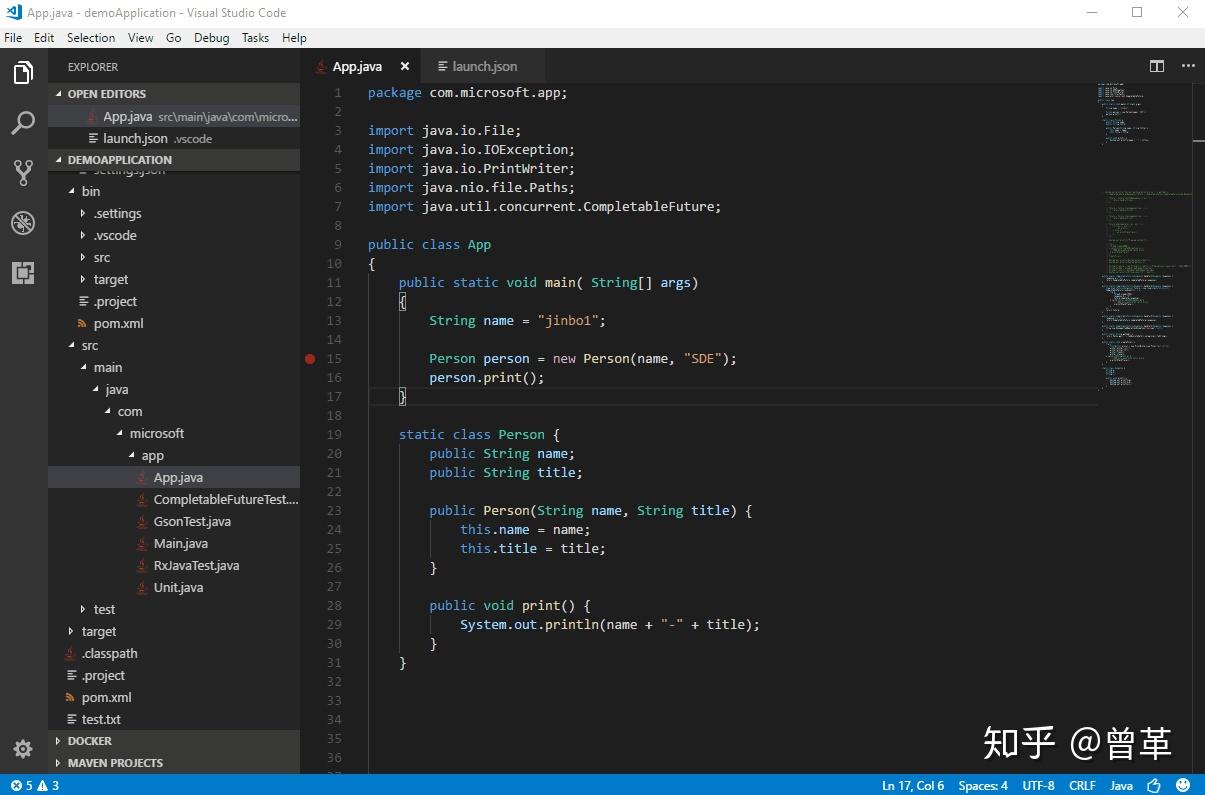
调试单个 Java 文件
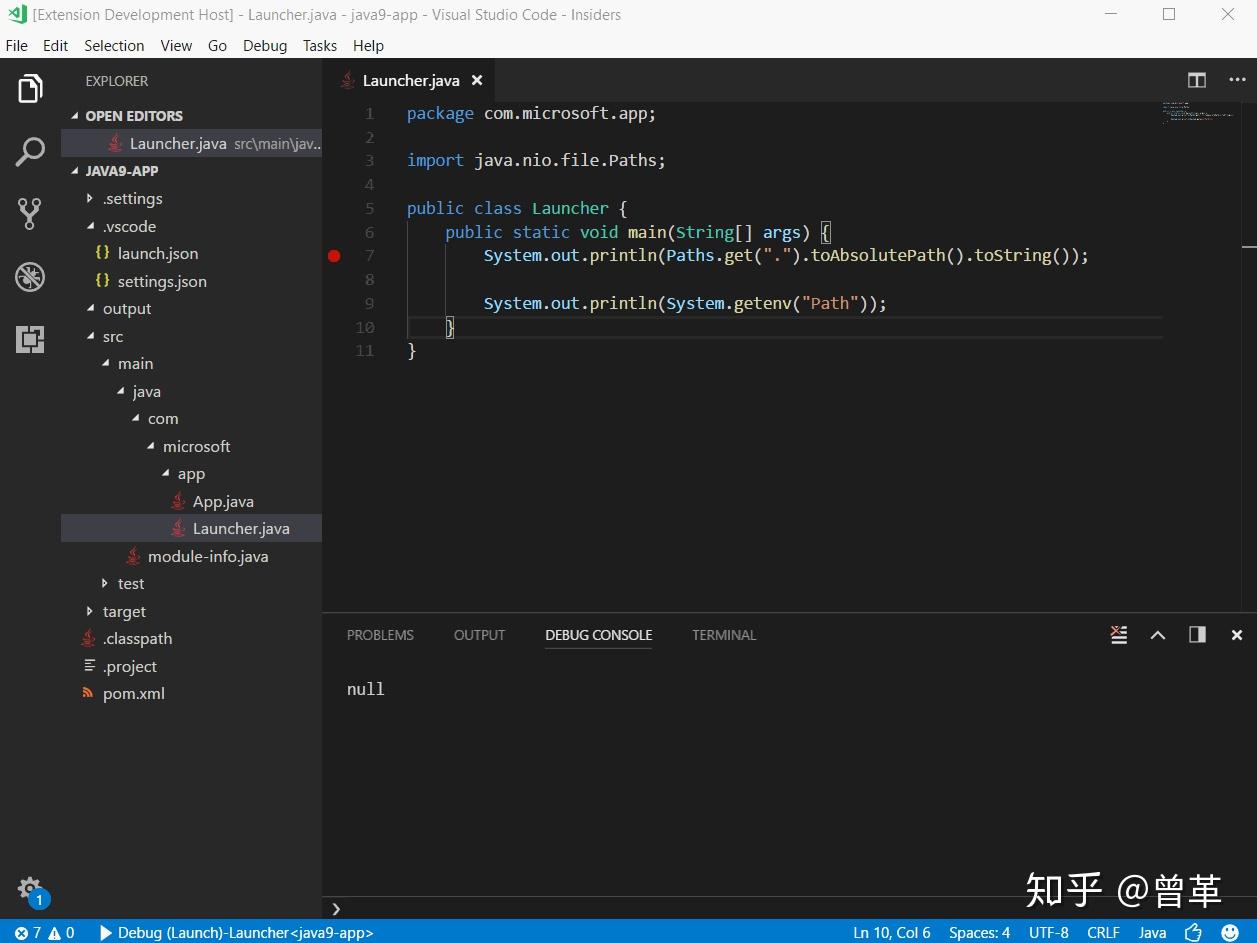
VS Code 能调试不在任何 Java Project 中的单独存在的 Java 程序。
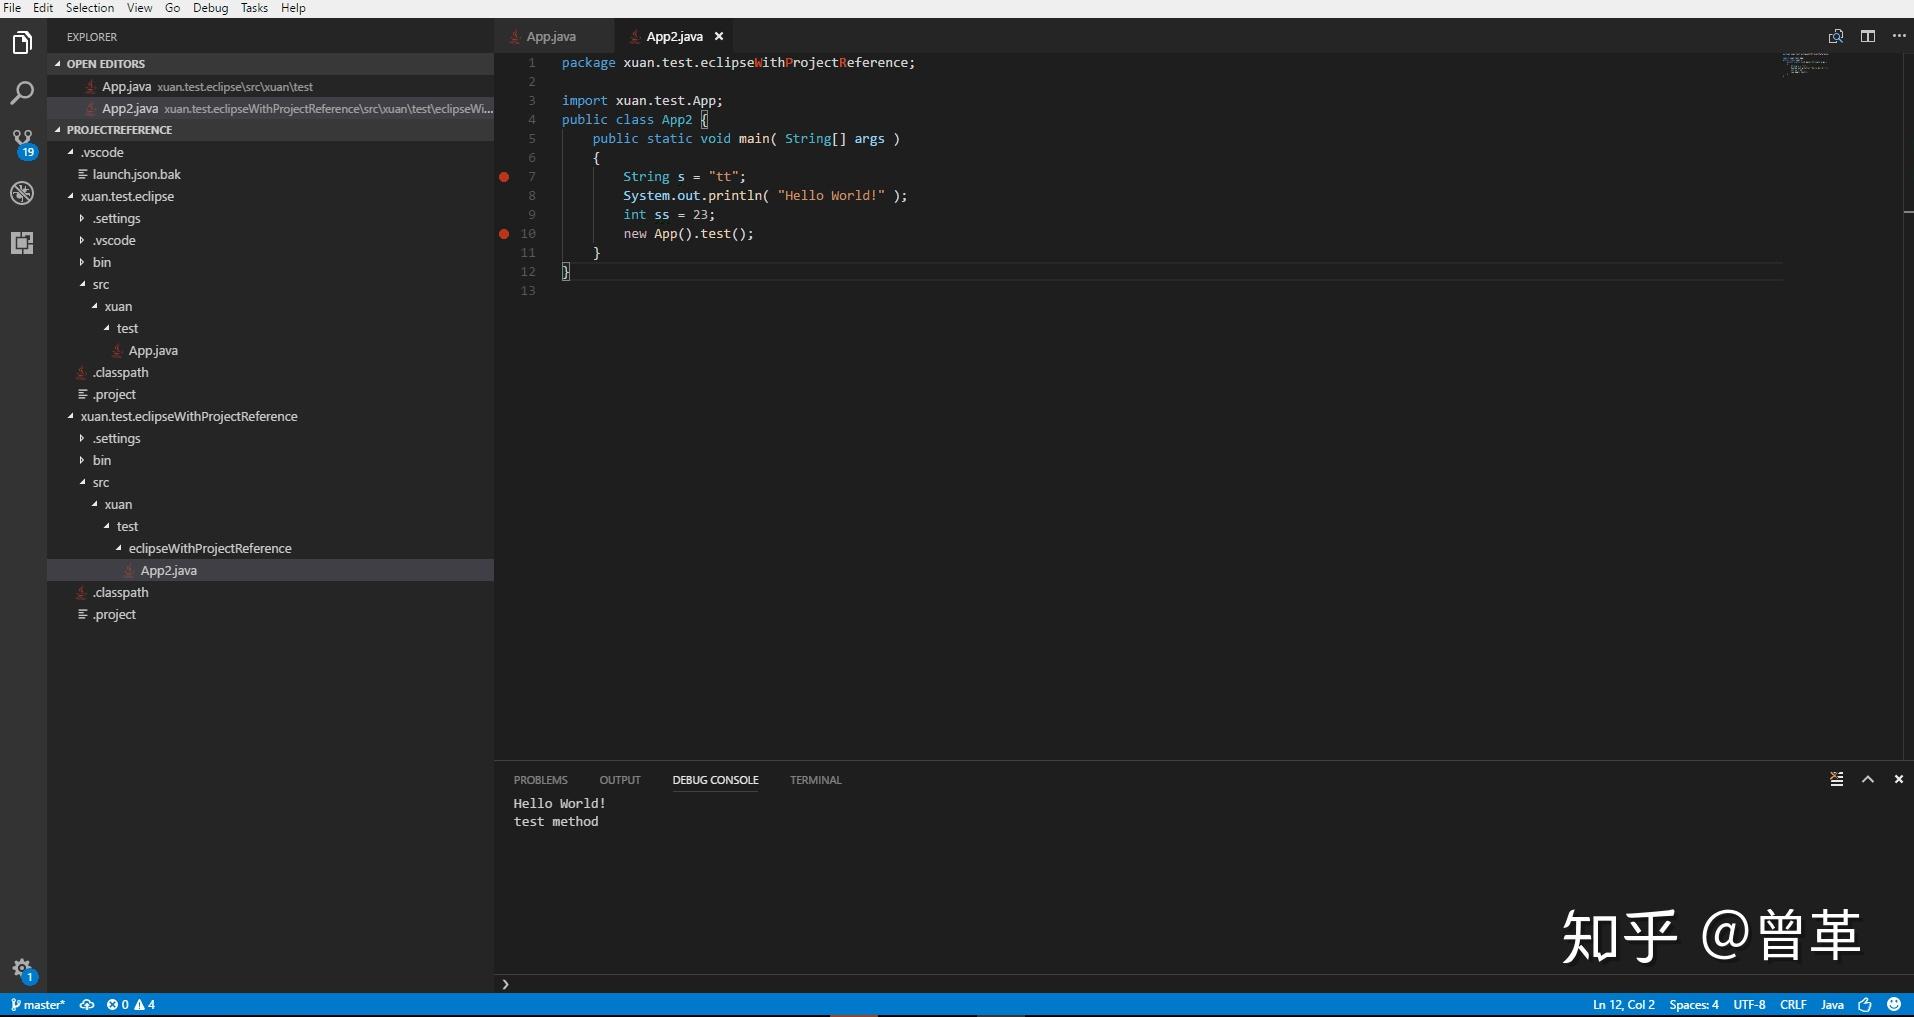
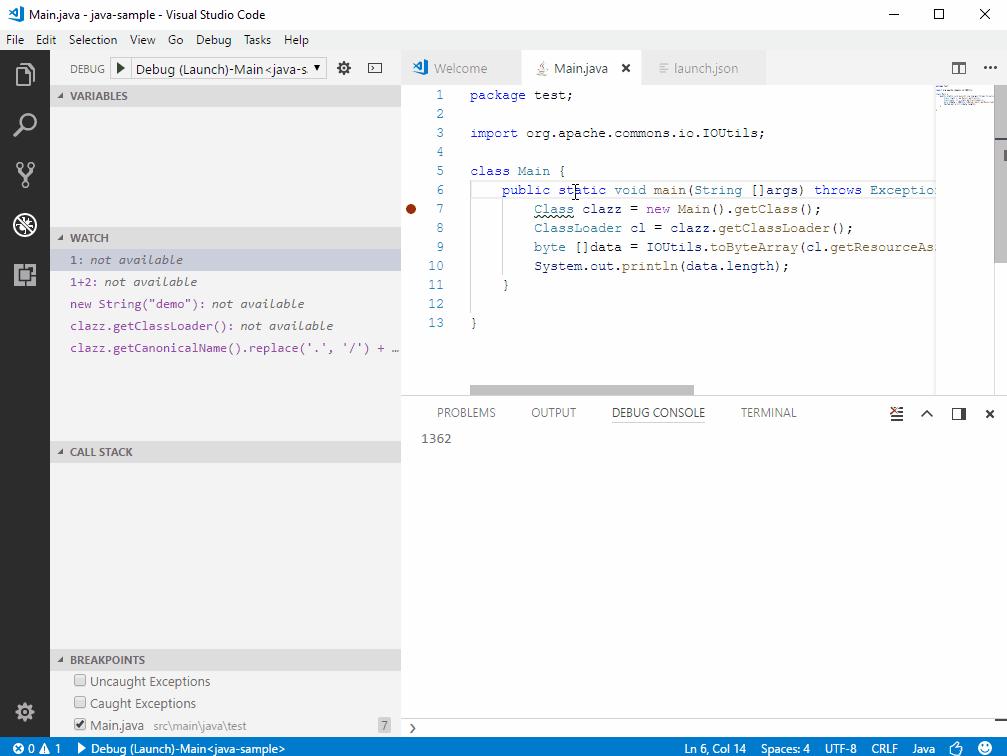
调试扩展文件
调试器同样支持调试第三方 Jar 包中的 classes 的源码。你只需要在调试前在 class 中打好断点。VS Code 对 Java 9 支持的非常好。
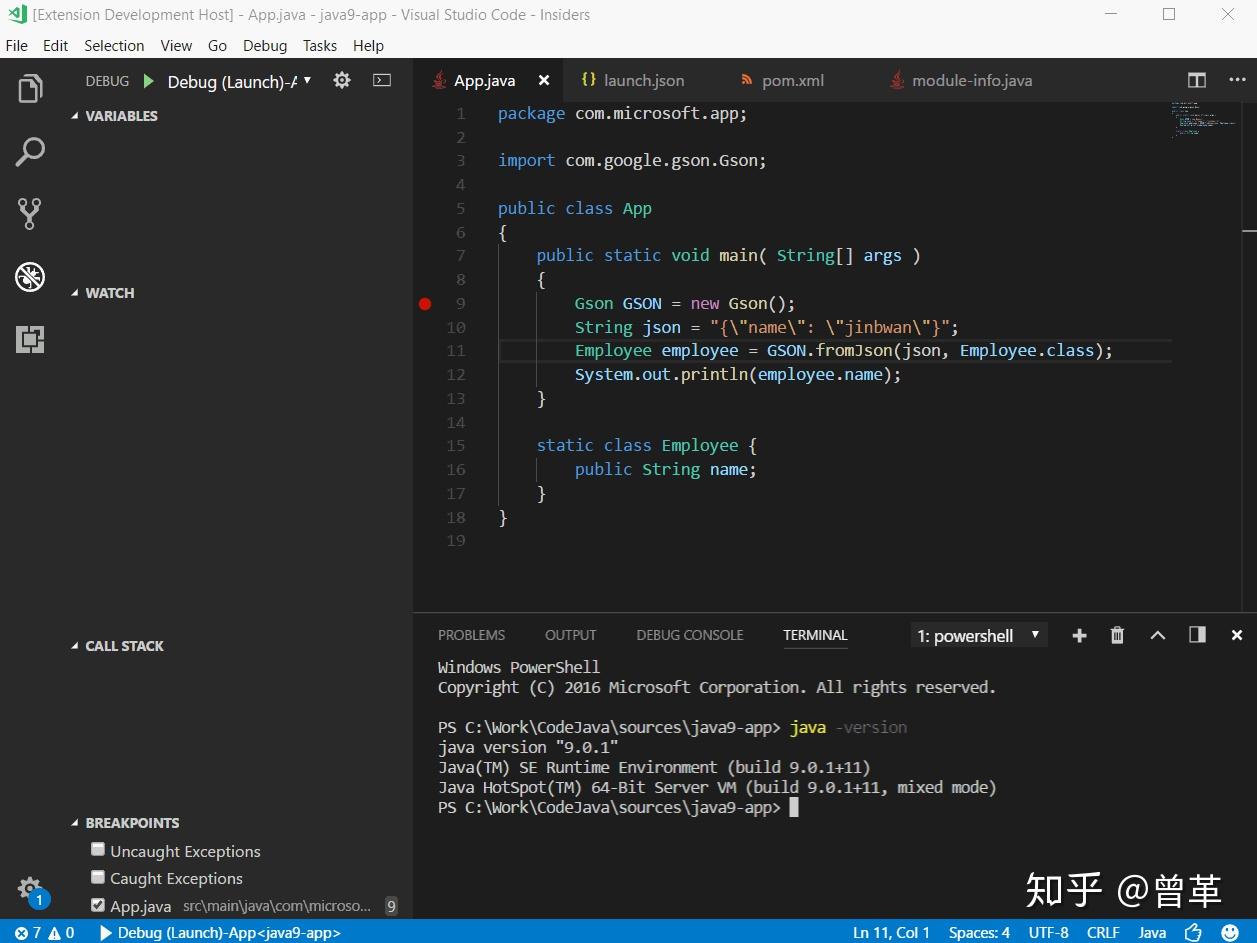
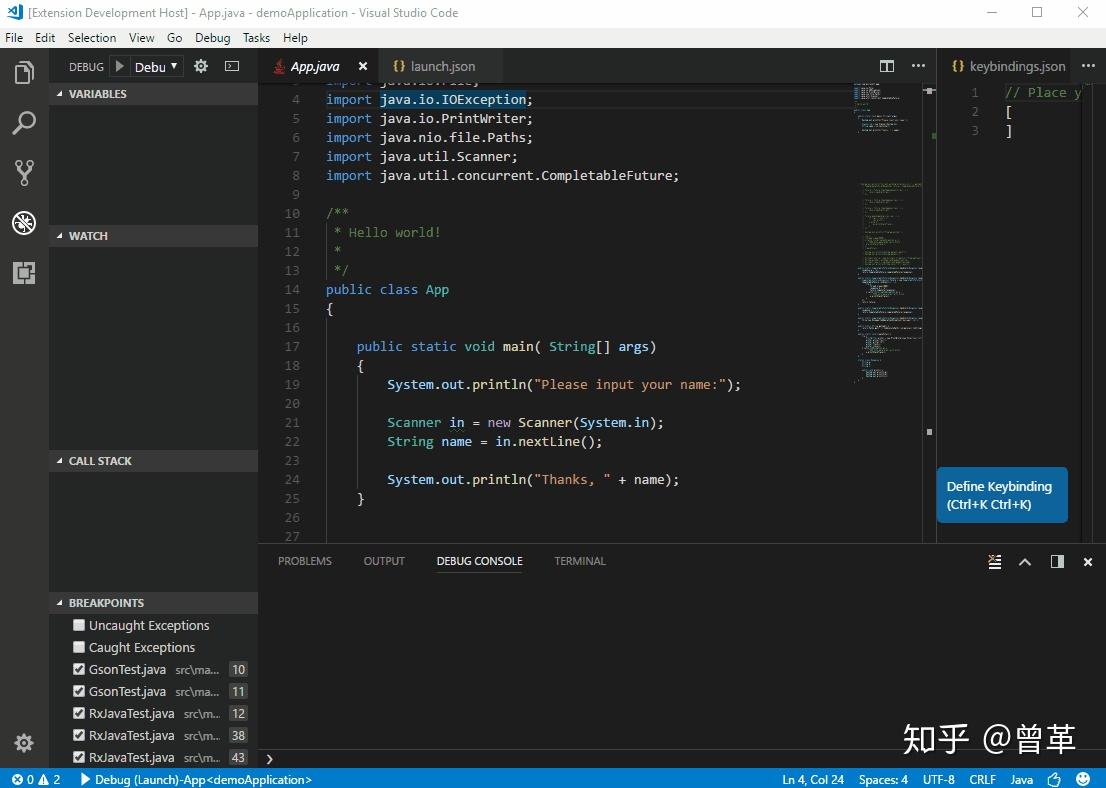
接受输入值的调试
默认的调试控制台不支持输入,如果你的程序需要从一个 terminal 接收数据,你可以使用 VS Code 集成的 terminal,或者是在扩展库里找一个支持该操作的 terminal 来启动调试程序。
Step filter
插件支持 Step filter(步进过滤),可以让你跳过调试过程中不需要看到的步骤。你可以在 lanuch.json 配置需要跳过的 packages,比如下面的 java.lang.classLoader(动图有问题,请查阅官方文档)。
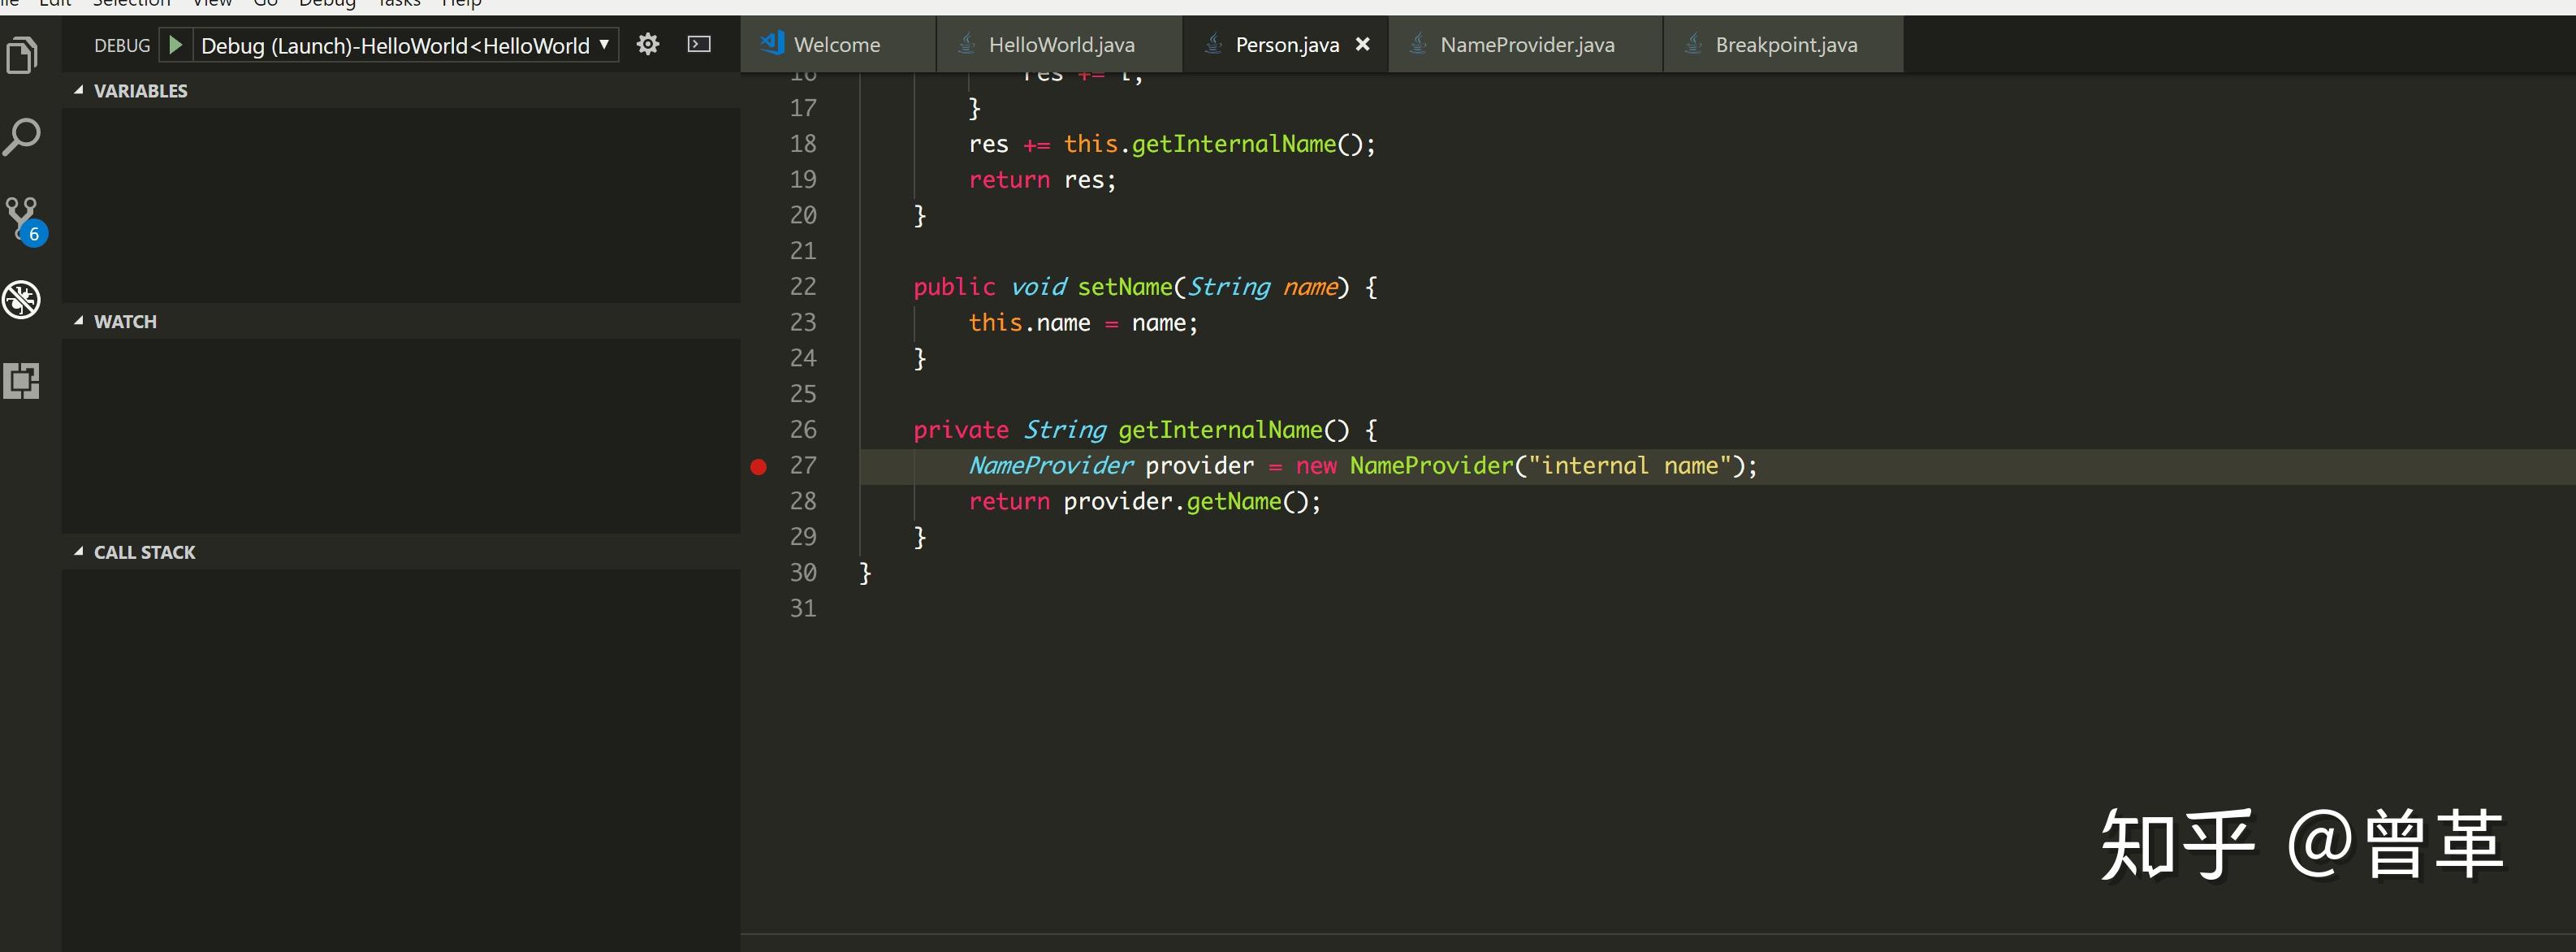
调试器支持你在 WATCH window 计算某些表达式的值,你可以利用此功能来设置一些有附加条件的断点。
Hot Code replacement
另一个智能的调试功能就是在调试中进行'Hot Code' replacement,Java 调试器通过正在调试的这个通道向另一个 JVM 传递新的 class 文件(个人觉得这句话翻译的不太好)。这项功能对需要不停进行“试错编码“的情况下很不错。利用这个功能,你可以在启动一个调试环境后,修改正在调试的 Java 代码,然后调试器会给正在运行的 JVM 中替换新的代码,而不需要你重新启动调试程序,这也是为什么它被称为 “hot”的原因。下面的动图给你演示了如何使用这项功能(动图有问题,可参看官方文档中的动图)。
配置
调试器支持非常多的设置选项,比如你可以在启动配置中很方便的设置当前工作目录、环境变量等。
可以查阅 Language Support for Java by Red Hat 的文档说明来查看更多设置选项。
(下面是一些启动调试器的参数设置项)
启动
- mainClass (required) - The main class of the program (fully qualified name, e.g. [mymodule/]com.xyz.MainClass).
- args - The command line arguments passed to the program.
- sourcePaths - The extra source directories of the program. The debugger looks for source code from project settings by default. This option allows the debugger to look for source code in extra directories.
- modulePaths - The module paths for launching the JVM. If not specified, the debugger will automatically resolve from current project.
- classPaths - The class paths for launching the JVM. If not specified, the debugger will automatically resolve from current project.
- encoding - The file.encoding setting for the JVM. If not specified, 'UTF-8' will be used. Possible values can be found in Supported Encodings.
- vmArgs - The extra options and system properties for the JVM (e.g. -Xms<size> -Xmx<size> -D<name>=<value>).
- projectName - The preferred project in which the debugger searches for classes. There could be duplicated class names in different projects. This setting also works when the debugger looks for the specified main class when launching a program. It is required for expression evaluation.
- cwd - The working directory of the program.
- env - The extra environment variables for the program.
- stopOnEntry - Automatically pause the program after launching.
- console - The specified console to launch the program. Defaults to internalConsole.
- internalConsole - VS Code Debug Console (input stream not supported).
- integratedTerminal - VS Code Integrated Terminal.
- externalTerminal - External terminal that can be configured in user settings.
- stepFilters - Skip specified classes or methods when stepping.
- classNameFilters - Skip the specified classes when stepping. Class names should be fully qualified. Wildcard is supported.
- skipSynthetics - Skip synthetic methods when stepping.
- skipStaticInitializers - Skip static initializer methods when stepping.
- skipConstructors - Skip constructor methods when stepping.
Attach
- hostName (required) - The host name or IP address of remote debuggee.
- port (required) - The debug port of remote debuggee.
- timeout - Timeout value before reconnecting, in milliseconds (default to 30000ms).
- sourcePaths - The extra source directories of the program. The debugger looks for source code from project settings by default. This option allows the debugger to look for source code in extra directories.
- projectName - The preferred project in which the debugger searches for classes. There could be duplicated class names in different projects. This setting also works when the debugger looks for the specified main class when launching a program.
- stepFilters - Skip specified classes or methods when stepping.
- classNameFilters - Skip the specified classes when stepping. Class names should be fully qualified. Wildcard is supported.
- skipSynthetics - Skip synthetic methods when stepping.
- skipStaticInitializers - Skip static initializer methods when stepping.
- skipConstructors - Skip constructor methods when stepping.
User Settings
- java.debug.logLevel - Minimum level of debugger logs that are sent to VS Code, defaults to warn.
- java.debug.settings.showHex - Show numbers in hex format in the VARIABLES view, defaults to false.
- java.debug.settings.showStaticVariables - Show static variables in the VARIABLES view, defaults to true.
- java.debug.settings.showQualifiedNames - Show fully qualified class names in the VARIABLES view, defaults to false.
- java.debug.settings.maxStringLength - Maximum length of strings displayed in the VARIABLES view or Debug Console. Strings longer than this length will be trimmed. Default is 0 which means no trim is performed.
- java.debug.settings.enableHotCodeReplace - Enable Hot Code replacement for Java source code. Make sure the auto build is not disabled for VS Code Java. See the wiki page for more information about usages and limitations.
反馈和提问
你可以在 Issue Tracker 找到完整的 issues 列表。你也可以提交 bug or feature suggestion, 你也可以参与社区频道的发展 (and participate in the community driven Gitter channel ).
Run JUnit Tests
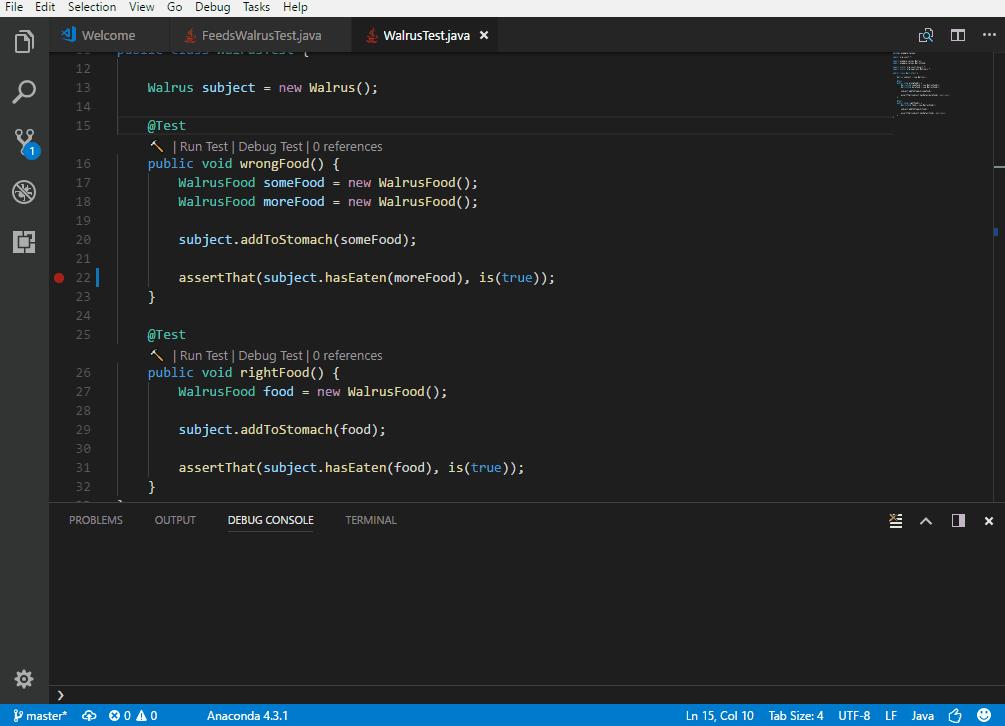
Java Test Runner 支持你启动调试你的测试用例。
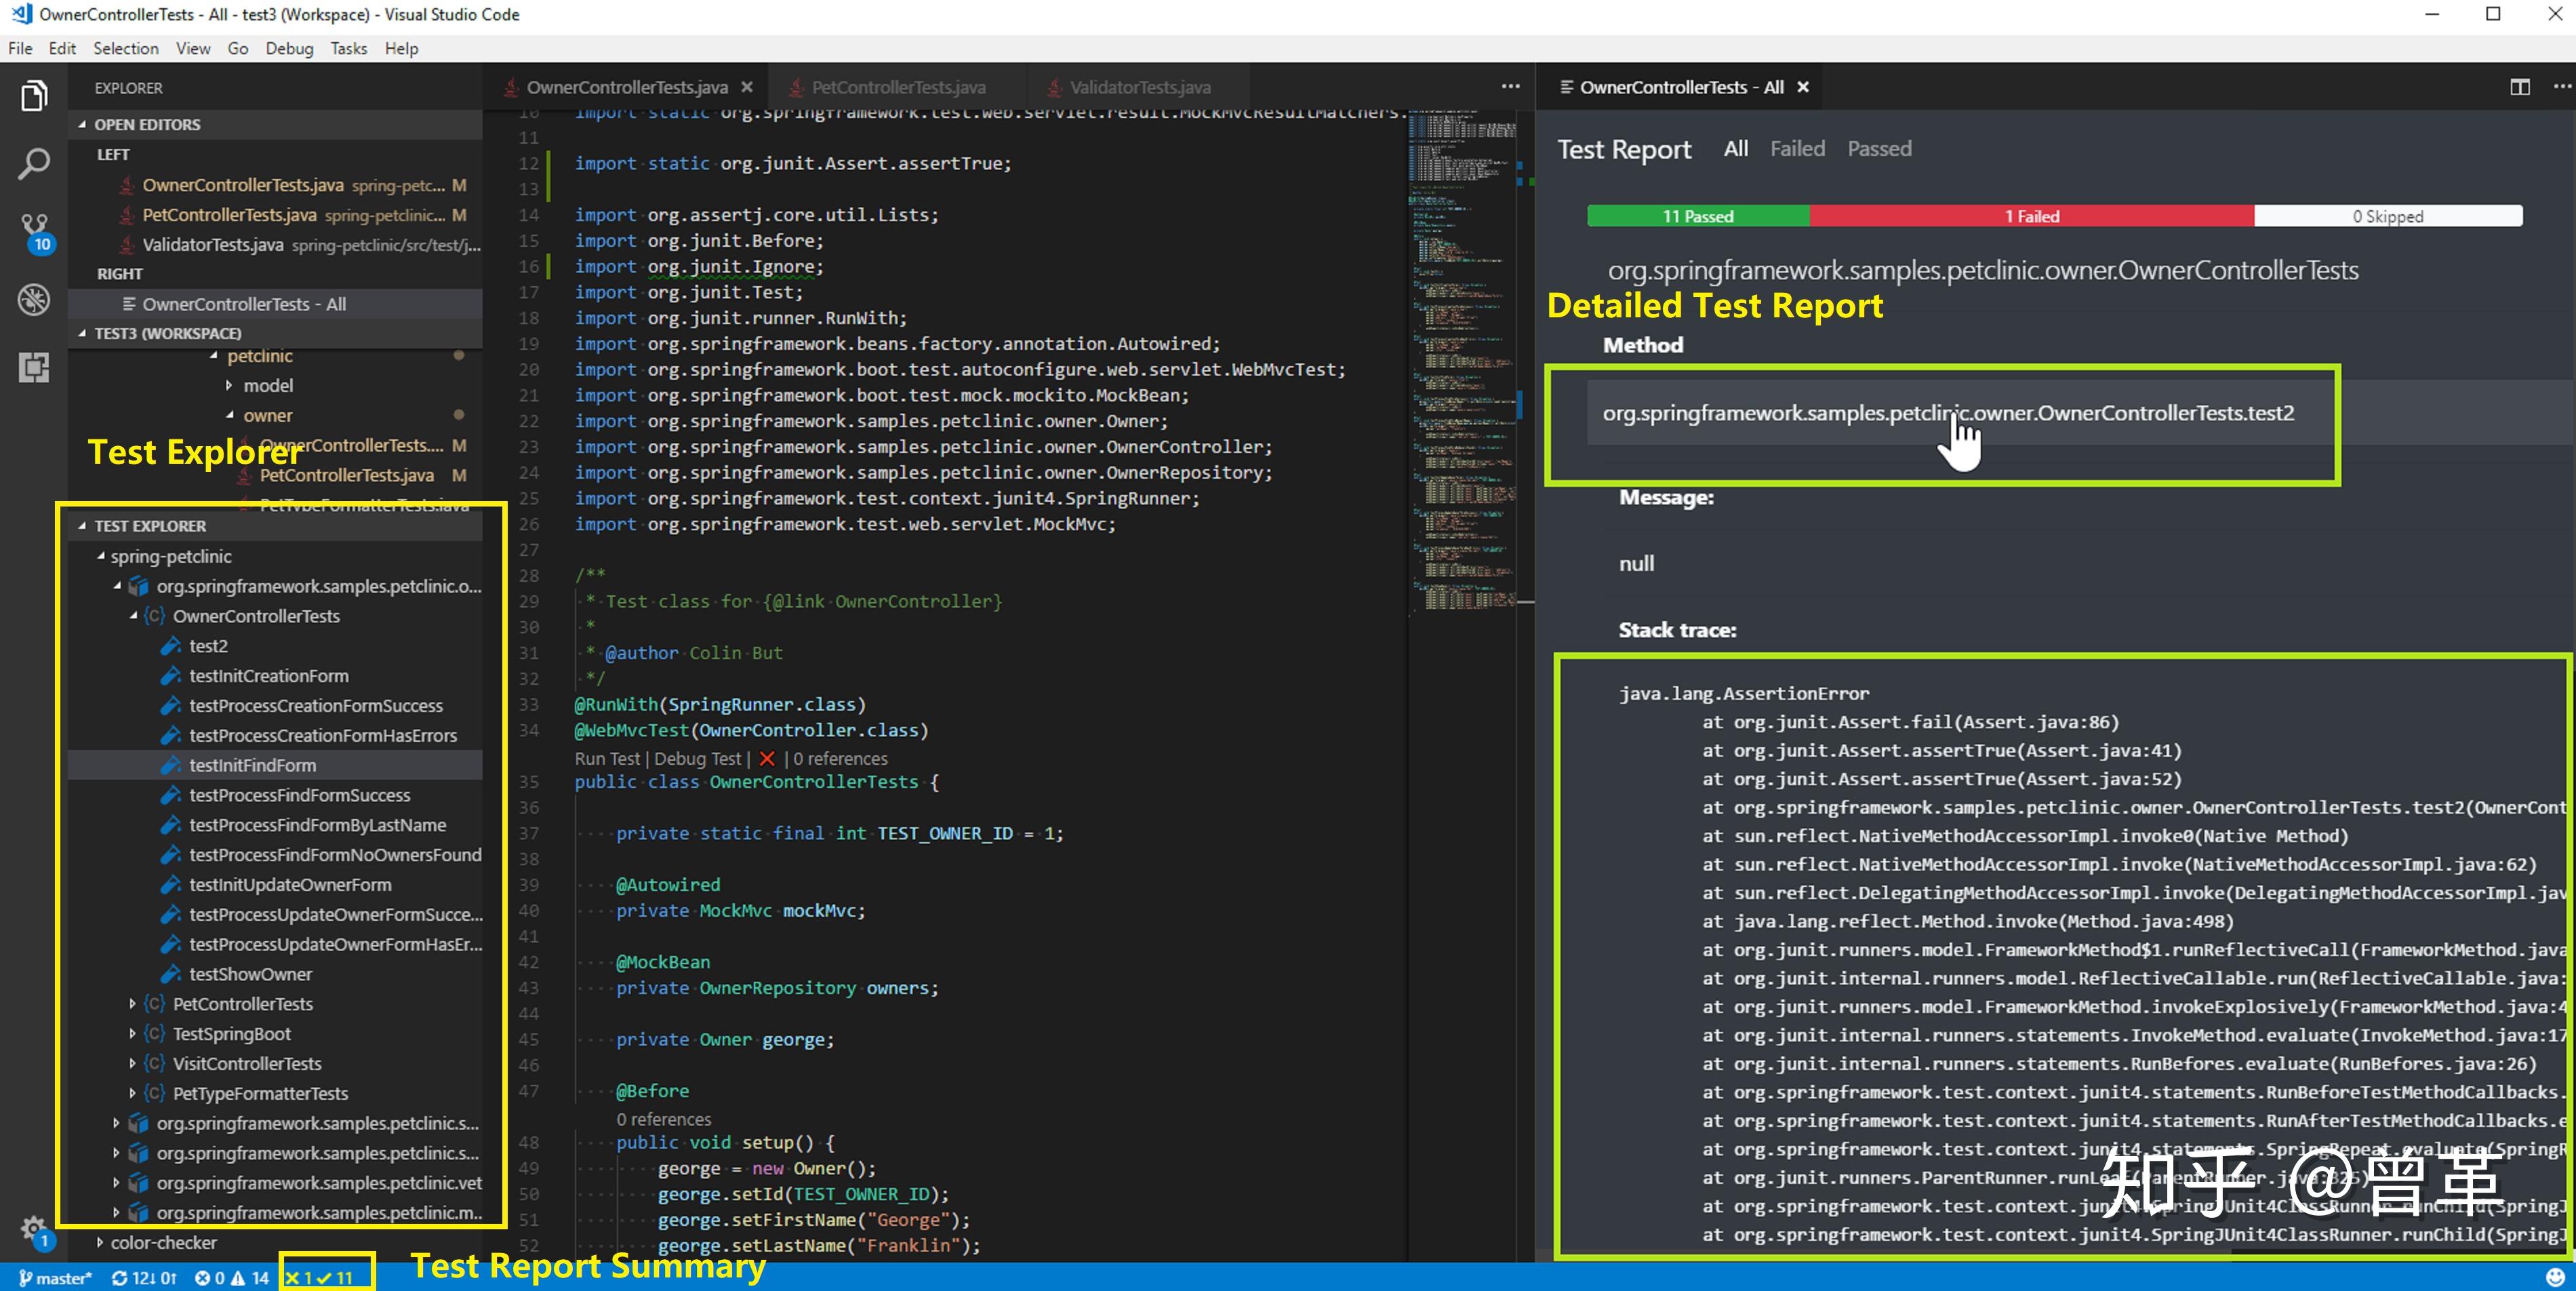
你同样可以通过 TEST EXPLORER 来管理你的测试用例。
以上就是官方文档中关于 Java 调试部分的内容。 |
|


 发表于 2023-4-10 17:09:06